BOM Analysis Beyond Excel: SQL-Native Product Similarity in DuckDB

Your new laptop launches in 6 weeks. Finance wants a demand forecast. Problem: zero sales history.
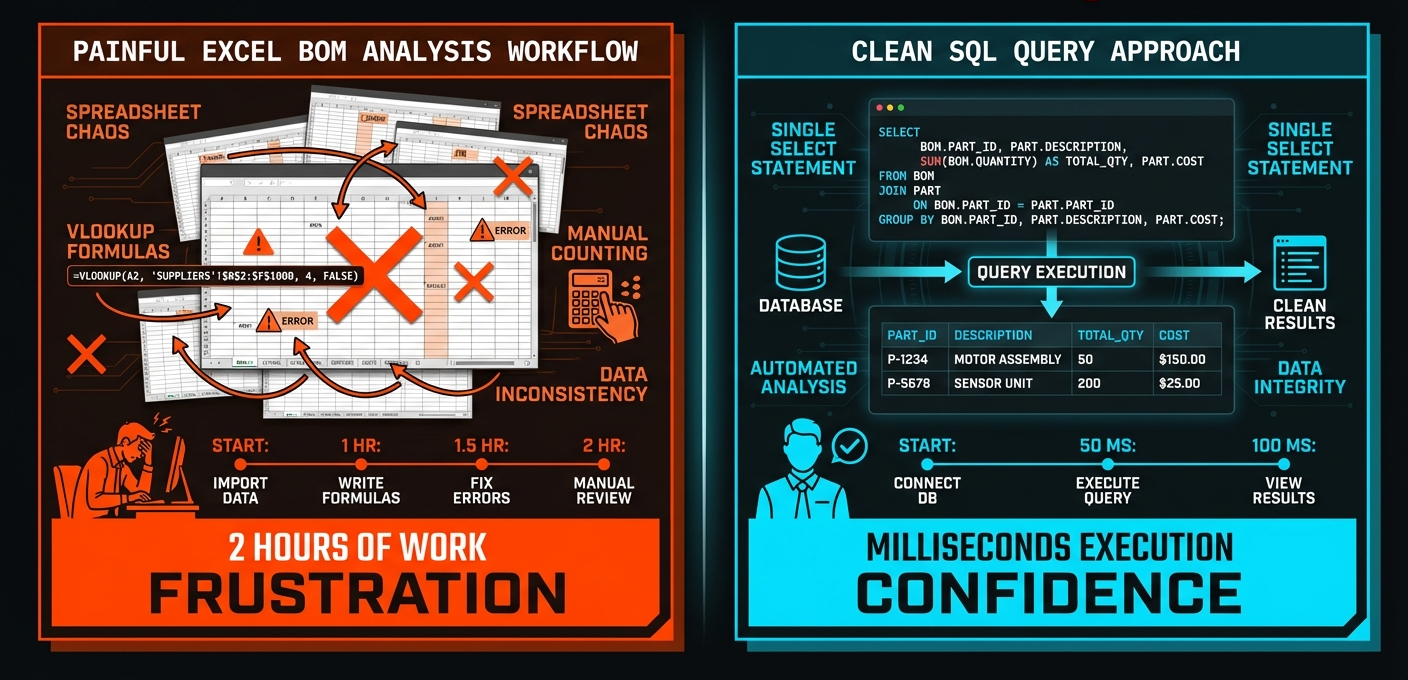
The S&OP playbook says: find similar products, use their history as analogs. But "which products are similar?" means comparing BOMs. And comparing BOMs often means... Excel. VLOOKUP. Manual counting. Hours later, you have five candidates and zero confidence it's complete.
The typical enterprise has 5,000-50,000 active products. Each BOM of one of these products might have 10-200 components. That's millions of potential comparisons. You need a system that can answer "what's similar to our new laptop?" in seconds, not hours.
The Example: Consumer Electronics BOMs
We'll demonstrate with a real dataset: the Figshare Consumer Electronics BOM dataset (CC0 licensed). It contains material composition data for 156 consumer electronics products. The material compositions are unfortunately not real BOMs, but close enough for our purposes:
- 156 products: iPhones, Samsung Galaxy phones, laptops, TVs, gaming consoles, printers
- 11 material types: aluminum, copper, PCB, Li-ion battery, plastics, steel, glass
- 1,097 BOM relationships: product-to-material mappings with mass quantities
This dataset lets us test: Can we find iPhone analogs? Do laptops cluster together? Does BOM similarity predict product similarity?
Here's what two BOMs look like— first for a smartphone:
And the second for a CRT TV:
Both share core materials (aluminum, copper, PCB, plastic, steel). But the discriminating materials differ: smartphones have Li-ion batteries and flat panel glass; CRT TVs have CRT glass and no battery. This is why they cluster into different categories.
The Solution: SQL-Native BOM Similarity
We built anofox-similarity—a DuckDB extension that brings graph-based product similarity directly into SQL.
-- Your new laptop launches in 6 weeks. Find forecast analogs.
SELECT * FROM find_similar_materials('LAPTOP-NEW-2026', k := 5);
That's it. One function call. Results in milliseconds.
No Python scripts. No data exports. No external services. Your BOM data stays in DuckDB, and similarity analysis becomes just another SQL query.
How It Works: Multi-Modal Similarity
Real product similarity isn't just about component overlap. A laptop and a tablet might share 80% of their materials—but have completely different demand patterns, descriptions, and assembly structures.
anofox-similarity uses three signals to find truly similar products:
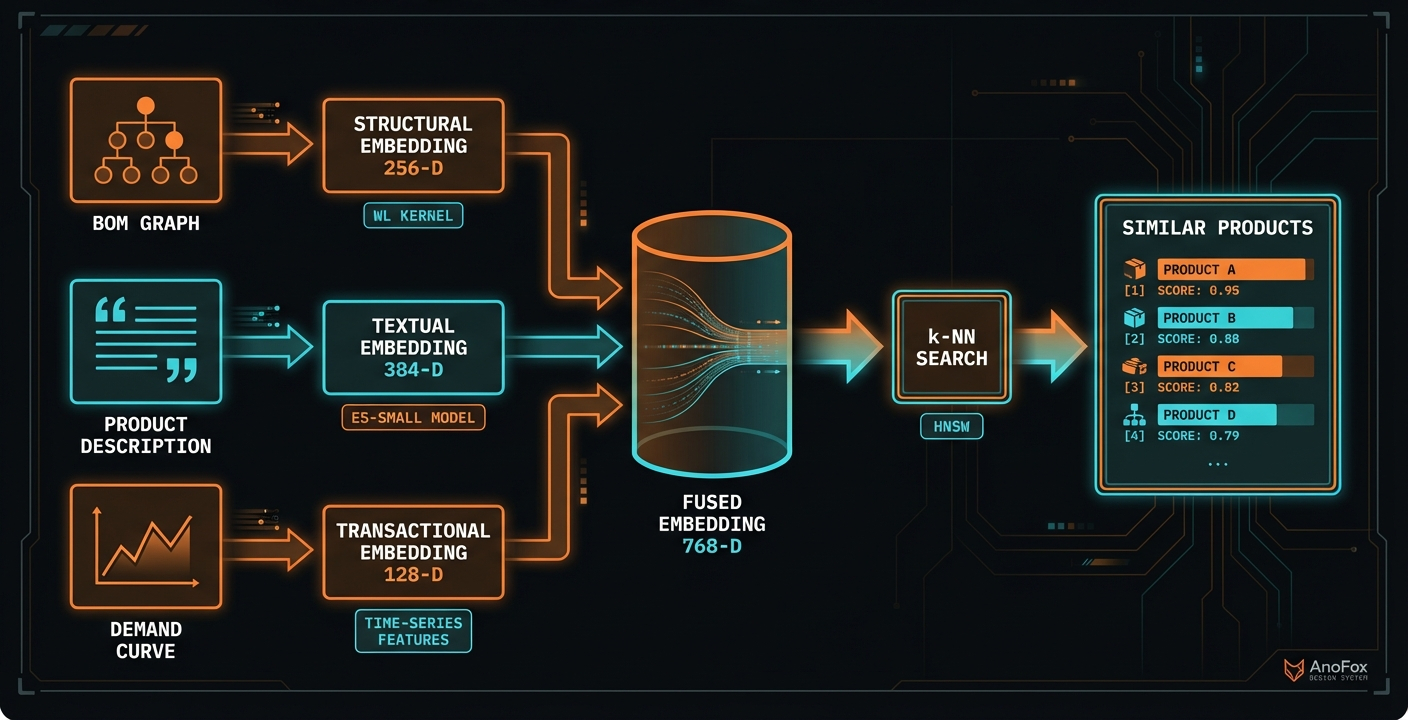
1. Structural Similarity (BOM Topology)
The extension analyzes the graph structure of your BOMs using the Weisfeiler-Lehman (WL) kernel. This captures:
- Which components are used together
- How materials are assembled into subassemblies
- The depth and shape of the BOM hierarchy
Two products with identical parts but different assembly structures will score differently—because structure affects manufacturing complexity, cost, and quality.
2. Textual Similarity (Product Descriptions)
Product names and descriptions carry semantic meaning. "Dell Latitude E6430" is textually similar to "HP EliteBook 8470p"—both are business laptops from the early 2010s.
The extension uses an E5-small embedding model (runs locally, no API calls) to convert descriptions into 384-dimensional vectors. Products with similar descriptions cluster together.
3. Transactional Similarity (Consumption Patterns)
Products with similar demand patterns are often good forecast analogs—even if their BOMs differ slightly. The extension extracts time-series features from goods movements:
- Consumption trends and seasonality
- Volatility and coefficient of variation
- Autocorrelation at different lags
This helps find products that behave similarly, not just look similar.
Fused Embeddings
All three signals combine into a single 768-dimensional embedding per product:
fused_embedding = [structural || textual || transactional]
Vector search then finds the k-nearest neighbors in milliseconds—even across 50,000+ products.
Finding Forecast Analogs
Let's load the consumer electronics dataset and find analogs for a laptop:
-- Load the extension
INSTALL anofox_similarity FROM community;
LOAD anofox_similarity;

-- Load the Figshare consumer electronics data
CREATE TABLE materials AS SELECT * FROM read_csv('materials.csv');
CREATE TABLE bom_items AS SELECT * FROM read_csv('bom_items.csv');

-- Initialize embeddings (builds structural + textual vectors)
SELECT similarity_init();
Now find the most similar products:
-- Find the 5 most similar products using multi-modal search
SELECT * FROM find_similar_materials(
    'DELL-LATITUDE-E6430-2012',
    k := 5,
    method := 'combined'  -- uses structural + textual fusion
);
Results:
| material_id | description | similarity |
|---|---|---|
| HP-ELITEBOOK-8470P-2012 | HP EliteBook 8470p (2012) | 0.94 |
| LENOVO-THINKPAD-T430-2012 | Lenovo ThinkPad T430 (2012) | 0.93 |
| DELL-LATITUDE-E6420-2011 | Dell Latitude E6420 (2011) | 0.92 |
| APPLE-MACBOOK-PRO-13-2012 | MacBook Pro 13" (2012) | 0.85 |
| MICROSOFT-SURFACE-PRO-2013 | Surface Pro (2013) | 0.76 |
Business laptops from the same era cluster tightly—they share similar BOMs, similar names ("EliteBook", "ThinkPad", "Latitude"), and likely similar demand patterns. The MacBook scores lower (different brand positioning), and tablets diverge further.
From Similarity to Forecast
For cold-start forecasting, use cold_start_analogs() to get weighted analogs directly:
-- Get forecast analogs with normalized weights
SELECT * FROM cold_start_analogs(
    'NEW-LAPTOP-2026',
    k := 3,
    method := 'combined'
);
Results:
| analog_material_id | similarity_score | forecast_weight |
|---|---|---|
| HP-ELITEBOOK-8470P-2012 | 0.94 | 0.36 |
| LENOVO-THINKPAD-T430-2012 | 0.93 | 0.35 |
| DELL-LATITUDE-E6420-2011 | 0.92 | 0.29 |
Interpretation: Your new laptop's forecast should weight HP EliteBook's history at 36%, ThinkPad T430 at 35%, and Dell Latitude E6420 at 29%. Feed these to your forecasting model for a data-driven analog forecast.
Beyond Cold-Start Forecasting
While this post focuses on the S&OP use case, BOM similarity enables other workflows:
- Material rationalization: Find near-duplicate SKUs for consolidation
- Impact analysis: Which products are affected by a component change?
- Product family clustering: Group products into variant families automatically
These are covered in Part 2 and Part 3 of this series.
Try It Yourself
-- Install the extension
INSTALL anofox_similarity FROM community;
LOAD anofox_similarity;

-- Load your BOM data (or use the Figshare sample dataset)
-- Initialize similarity engine
SELECT similarity_init();

-- Find similar products for forecasting
SELECT * FROM find_similar_materials('YOUR-NEW-PRODUCT', k := 5);

-- Get weighted analogs for cold-start forecasting
SELECT * FROM cold_start_analogs('YOUR-NEW-PRODUCT', k := 3);
In this series:
- BOM Analysis Beyond Excel — SQL-native product similarity for cold-start forecasting (this post)
- Understanding Similarity Algorithms — From Jaccard to WL kernels to multi-modal fusion
- Detecting Product Lifecycles — Automatic predecessor/successor detection
All of this runs in SQL. No external services, no data exports, no new tools to learn.